
बस syslog point करते ही AI डिवाइस type को automatically पहचान कर monitoring शुरू कर देता है #
जैसे ही कोई नया device syslog भेजना शुरू करता है, LLM log sample पढ़कर automatically तय कर देता है कि “यह एक Windows client है” या “यह एक firewall है”। यह उपयुक्त monitoring template apply करता है और तुरंत monitoring शुरू कर देता है। किसी manual device registration की जरूरत नहीं है।
पारंपरिक monitoring deployment का सबसे थकाऊ हिस्सा #
जब कोई monitoring tool deploy किया जाता है, तो सबसे ज्यादा effort लेने वाला काम initial setup नहीं बल्कि “device-by-device registration work” होता है।
चाहे Zabbix हो या कोई और SIEM, हर बार जब आप monitoring में कोई नया device add करते हैं, तो आपको “host registration → template selection → parser configuration → testing → production deployment” करना पड़ता है। 10 devices के लिए यह 2-3 person-days लगते हैं; 100 devices के लिए 20-30 person-days। और यह काम हर बार devices add या remove होने पर दोहराया जाता है।
BASTION इस पूरे step को खत्म कर देता है।
Mechanism की पूरी तस्वीर #
निम्नलिखित 5 steps पूरी तरह automatically चलते हैं।
| Step | यह क्या करता है | यह कब चलता है |
|---|---|---|
| 1. Log आगमन | नया device syslog भेजता है। rsyslog hostname के आधार पर automatically एक directory बनाता है | तुरंत |
| 2. नए host की detection | पिछली host list से तुलना कर नई directories खोजी जाती हैं | दिन में एक बार (cron) |
| 3. LLM classification | Log sample को LLM को भेजकर automatically device type तय किया जाता है | नई detection होने पर |
| 4. Template application | Classification result के आधार पर device registry में उपयुक्त monitoring template register की जाती है | Classification पूरी होने पर |
| 5. Monitoring शुरू | Template अगले periodic analysis (हर 15 minutes) में automatically invoke होता है | अगले cron execution पर |
यानी, device के syslog भेजना शुरू करने के 15 minutes के अंदर monitoring reports Slack में आ जाती हैं।
Step 1: rsyslog द्वारा directory का automatic generation #
BASTION का rsyslog, received syslog के hostname के आधार पर हर sending host के लिए automatically एक directory बनाता है।
/var/log/remote/
  Hostname-A/2026/04/Security-Auditing.log
  Hostname-B/2026/04/sshd.log
  Hostname-C/2026/04/filterlog.log
  ...
जब कोई नया device syslog भेजना शुरू करता है, तो बिना किसी configuration change के directory अपने आप बन जाती है। यही पूरे automation का starting point है।
Step 2: नए host की automatic detection #
एक detection script दिन में एक बार चलती है, जो directory list की पिछली list से तुलना करती है।
यहाँ जो सबसे अहम insight है वह एक counterintuitive approach है: “क्या monitor करना है” manage करने के बजाय, “क्या exclude करना है” manage करें। मौजूदा servers और network equipment (जिन्हें summarize.sh में पहले से individually parse किया जा रहा है) exclusion list में डाले जाते हैं, और बाकी सब कुछ “नया client” माना जाता है।
# Exclusion list (hostname patterns for servers/NW equipment)
EXCLUDE_HOSTS="existing-server1|existing-server2|existing-fw|..."

# Subtract exclusion list from /var/log/remote/ host list
# → Remaining items are new clients
Detection results के आधार पर Slack को notify किया जाता है।
| Situation | Notification |
|---|---|
| नया host दिखा | “एक नए client ने logs भेजना शुरू कर दिया है। Auto-classify करके monitoring शुरू की जा रही है” |
| Logs रुक गए | “इस client से logs आना बंद हो गया है। कृपया NXLog status check करें” |
| 48+ घंटों से inactive | “48 घंटे या उससे अधिक समय से logs update नहीं हुए हैं” |
| कोई बदलाव नहीं | कोई notification नहीं (सिर्फ log) |
Step 3: LLM द्वारा automatic classification #
यही core हिस्सा है। जब कोई नया host detect होता है, तो उस host की log files में से एक sample (top 5 files × last 20 lines) निकालकर classification के लिए LLM को भेजा जाता है।
क्या classify किया जाता है #
Classification निम्नलिखित 9 categories में किया जाता है।
| Category | Device type | Log की characteristics (LLM क्या देखता है) |
|---|---|---|
| win_client | Windows client | Security-Auditing, LogonType 2/10, PowerShell |
| win_server | Windows Server | Security-Auditing, Kerberos TGT/TGS, Directory Service |
| linux | Linux server | sshd, sudo, systemd, kernel |
| firewall | Firewall | filterlog, block/pass, NAT, VPN |
| switch | L2/L3 switch | link up/down, STP, loop |
| loadbalancer | Load balancer | backend, frontend, health check |
| webserver | Web server | HTTP status, GET/POST, access_log format |
| router | Router | BGP, OSPF, routing |
| unknown | Classify नहीं हो सका | ऊपर में से किसी से match नहीं हुआ → human को escalate होता है |
LLM को classification request #
Request सीधे GPUStack (local LLM server) के OpenAI-compatible API को भेजी जाती है। Prompt में hostname, log file list, और log sample शामिल होते हैं, साथ में classification results को JSON format में लौटाने का instruction।
# Classification request (overview)
curl -s -X POST "${GPUSTACK_URL}/v1/chat/completions" \
  -H "Authorization: Bearer ${API_KEY}" \
  -d '{
    "model": "qwen2.5-14b-instruct",
    "messages": [{
      "role": "system",
      "content": "You are a device classifier. Classify this host..."
    }, {
      "role": "user",
      "content": "Hostname: XXX\nLog files: ...\nSample: ..."
    }],
    "temperature": 0.1
  }'

# → Response example
{
  "category": "win_client",
  "confidence": "high",
  "os_detail": "Windows 10/11 desktop",
  "reasoning": "Security-Auditing logs with LogonType 2..."
}
LLM response में से JSON हिस्सा निकालकर device registry में register किया जाता है।
Implementation के दौरान सामने आई एक दिक्कत: OpenClaw के जरिए call करने पर सब कुछ unknown classify हो जाता था #
शुरुआत में LLM को OpenClaw (AI agent platform) के जरिए call किया जा रहा था, लेकिन classification prompt में मौजूद “win_client” और “firewall” जैसे keywords, AGENTS.md (system prompt) की keyword mapping में interfere कर रहे थे, जिस वजह से LLM classification करने के बजाय tool invocation strings लौटा देता था। Solution सीधा था: सिर्फ classification के लिए OpenClaw को bypass करें और curl से सीधे GPUStack API को call करें। Keyword interference खत्म करने के लिए prompt को भी English में convert किया गया।
एक और दिक्कत: bash heredoc और pipe stdin की collision #
Python में JSON extraction लिखते समय, bash heredoc (<<'EOF') pipe के standard input को capture कर लेता था, जिस वजह से Python का json.load(sys.stdin) खुद Python code को ही पढ़ने की कोशिश करता था। हमेशा empty classification results ही लौट रहे थे। Python वाले हिस्से को एक external script में move करने से यह resolve हो गया। Bug logically सही था लेकिन चलता नहीं था—बिना किसी output के 100% reproducible, और इसमें debugging का काफी समय खर्च हुआ।
Step 4: Template-आधारित monitoring #
Device registry #
Classification results एक JSON file (device registry) में accumulate होते हैं।
{
  "devices": [
    {
      "hostname": "CLIENT-001",
      "category": "win_client",
      "template": "win_client.sh",
      "confidence": "high",
      "os_detail": "Windows 10/11 desktop",
      "active": true
    },
    ...
  ],
  "exclude_hosts": ["existing-server1", "existing-fw", ...],
  "last_scan": "2026-04-21T06:00:00+09:00"
}
Monitoring templates #
हर category के लिए template scripts तैयार की जाती हैं। हर template दो functions provide करता है।
# templates/win_client.sh

# Summary output (called from summarize.sh)
template_summarize_win_client() {
    # Count authentication anomalies, PowerShell, USB, account changes
}

# Detailed analysis (called from analyze-detail.sh)
template_detail_win_client() {
    # Per-endpoint failed logon details, privileged logon details, LOLBin detection...
}
मौजूदा summarize.sh (periodic analysis script) के अंत में एक block add किया जाता है जो device registry पढ़कर dynamically templates को call करता है।
# Appended to end of summarize.sh
jq -r '.devices[] | select(.active==true) | ...' device-registry.json \
| while read HOST CATEGORY TEMPLATE; do
    source "templates/${TEMPLATE}"
    template_summarize_${CATEGORY} "$HOST" ...
done
मौजूदा hardcoded sections को छुआ तक नहीं जाता; सिर्फ append किए गए sections नई functionality जोड़ते हैं।
Step 5: पूरी तरह automatic results #
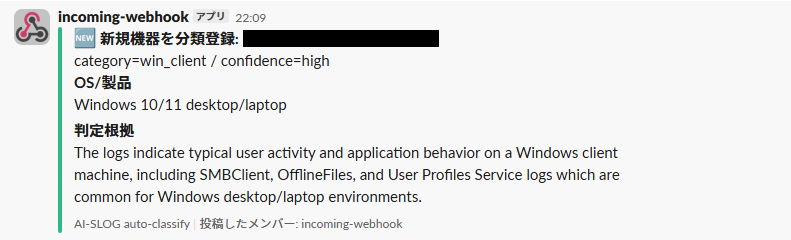
पहले scan में automatically 14 Windows clients detect हुए। LLM ने हर endpoint के log sample को पढ़ा और तय किया “Security-Auditing logs में logon events हैं → Windows client”। win_client template automatically apply हुआ, और authentication anomalies, तथा PowerShell execution, तथा USB connections, तथा account changes—इन 4 categories की monitoring तुरंत शुरू हो गई।
LLM classification की accuracy #
14 devices में से 13 confidence: high के साथ सही तरीके से classify हुए। एक को confidence: high के साथ “win_server” classify किया गया, लेकिन असल में वह एक Windows client था। ऐसा माना जा रहा है कि इसकी वजह hostname में server जैसा सुझाव देने वाला text होना है।
चूँकि win_client और win_server एक ही monitoring template share करते हैं, इसलिए इसका practical impact नहीं है। हालाँकि, अगर category की accuracy महत्वपूर्ण हो जाती है तो हम device registry में category field को manually correct करने के लिए एक override feature पर विचार कर रहे हैं।
मौजूदा monitoring के साथ coexistence #
BASTION में पहले से ही firewall, authentication infrastructure, तथा load balancer, switch, और web server के लिए summarize.sh में hardcoded analysis procedures मौजूद हैं। Automatic classification का target इन मौजूदा devices को छोड़कर बाकी बचे devices हैं।
हम उन चीजों को तोड़ने का risk नहीं लेते जो पहले से काम कर रही हैं। भविष्य में मौजूदा hardcoded हिस्सों को भी templates में convert करके integrate किया जा सकता है, लेकिन फिलहाल एक “two-layer structure” मौजूद है: “मौजूदा equipment = hardcoded” और “नया equipment = template auto-applied”।
भविष्य का expansion #
फिलहाल 2 प्रकार के templates हैं: win_client और generic (unknown), लेकिन हर customer deployment के साथ और templates add होते रहेंगे।
| Template | Status | मुख्य monitoring items |
|---|---|---|
| win_client / win_server | Implemented | Authentication anomalies, PowerShell, USB, तथा account में बदलाव |
| generic (unknown के लिए) | Implemented | error/warning/critical की count |
| linux | Planned | SSH authentication, sudo execution, तथा systemd services और OOM |
| firewall | Planned | Block count, attack source IP, तथा port distribution और VPN |
| switch | Planned | Link down, STP changes, तथा loops और storms |
जैसे-जैसे template library बढ़ती जाएगी, सिर्फ “syslog point करके” handle किए जा सकने वाले devices की range भी बढ़ती जाएगी, और यह सीधे accumulate होने वाला competitive advantage बन जाता है।
Summary #
BASTION का automatic device classification निम्नलिखित को पूरी तरह automatically करता है: rsyslog automatic directory generation → host detection → LLM log classification → template auto-application → monitoring शुरू। बस syslog destination configure करें, और device type की determination, monitoring rule selection, और device change management—सब automate हो जाता है।
यह एक ऐसा mechanism है जो पारंपरिक monitoring deployment की सबसे बड़ी bottleneck—”per-device registration and configuration”—को structurally खत्म कर देता है। चाहे 10 devices हों या 100, इंसान का काम same रहता है (सिर्फ syslog destination configuration की एक line)। “किसी को पता चले बिना devices monitoring से बाहर रह गए” जैसी समस्या structurally हो ही नहीं सकती।
BASTION closed networks में AI security monitoring deliver करने वाली एक service है।