
Client Portal Guide
Client Portal: Logs and Resource Usage (Resource) Verification Guide #
This procedure document explains how to view logs and check resource graphs (usage) on the client portal.
Notice:
This procedure document was created using generative AI and other tools, so the positions of annotations (arrows, frames, numbers, etc.) in the screen captures may appear slightly offset from the actual screen.
This is intended for understanding the procedure steps; please prioritize the actual screen display and text content when performing operations.
Prerequisites #
- You are logged in to the client portal
- You have opened the details screen for the target service (e.g., VPS, etc.)
Viewing Logs #
1. Open the logs screen #
- Click “Logs” from the menu on the service details screen.
- The logs list (date/time, description, status) will be displayed.
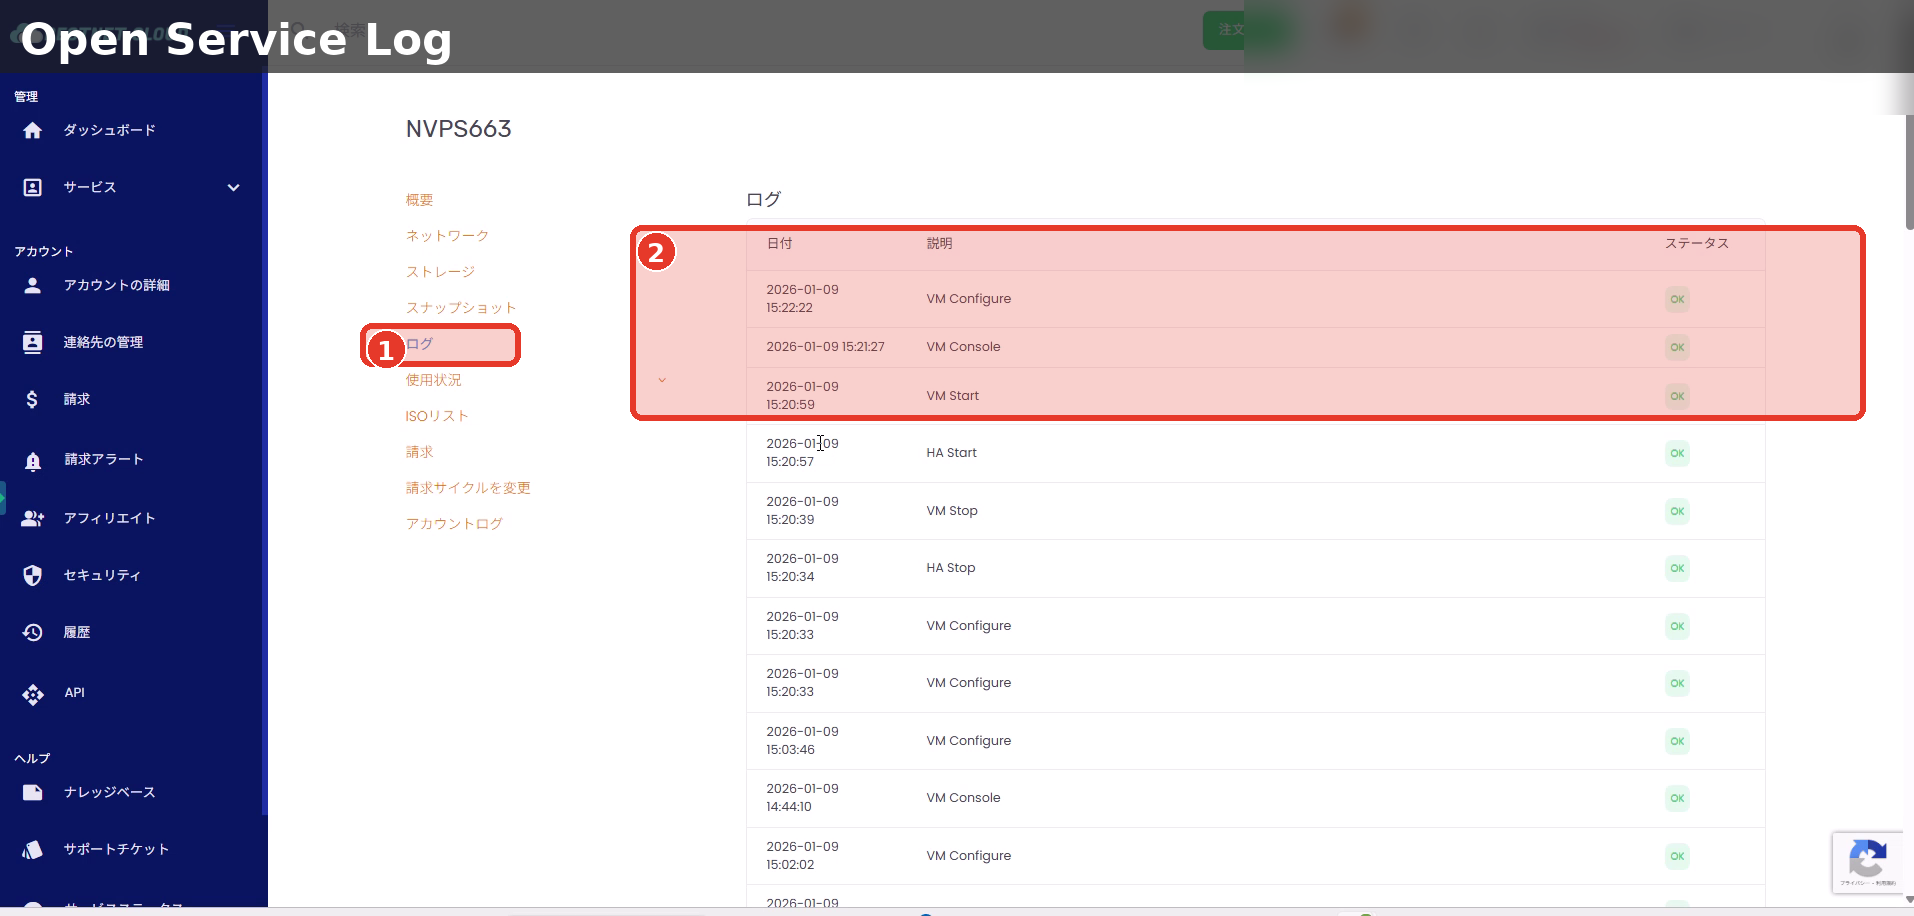
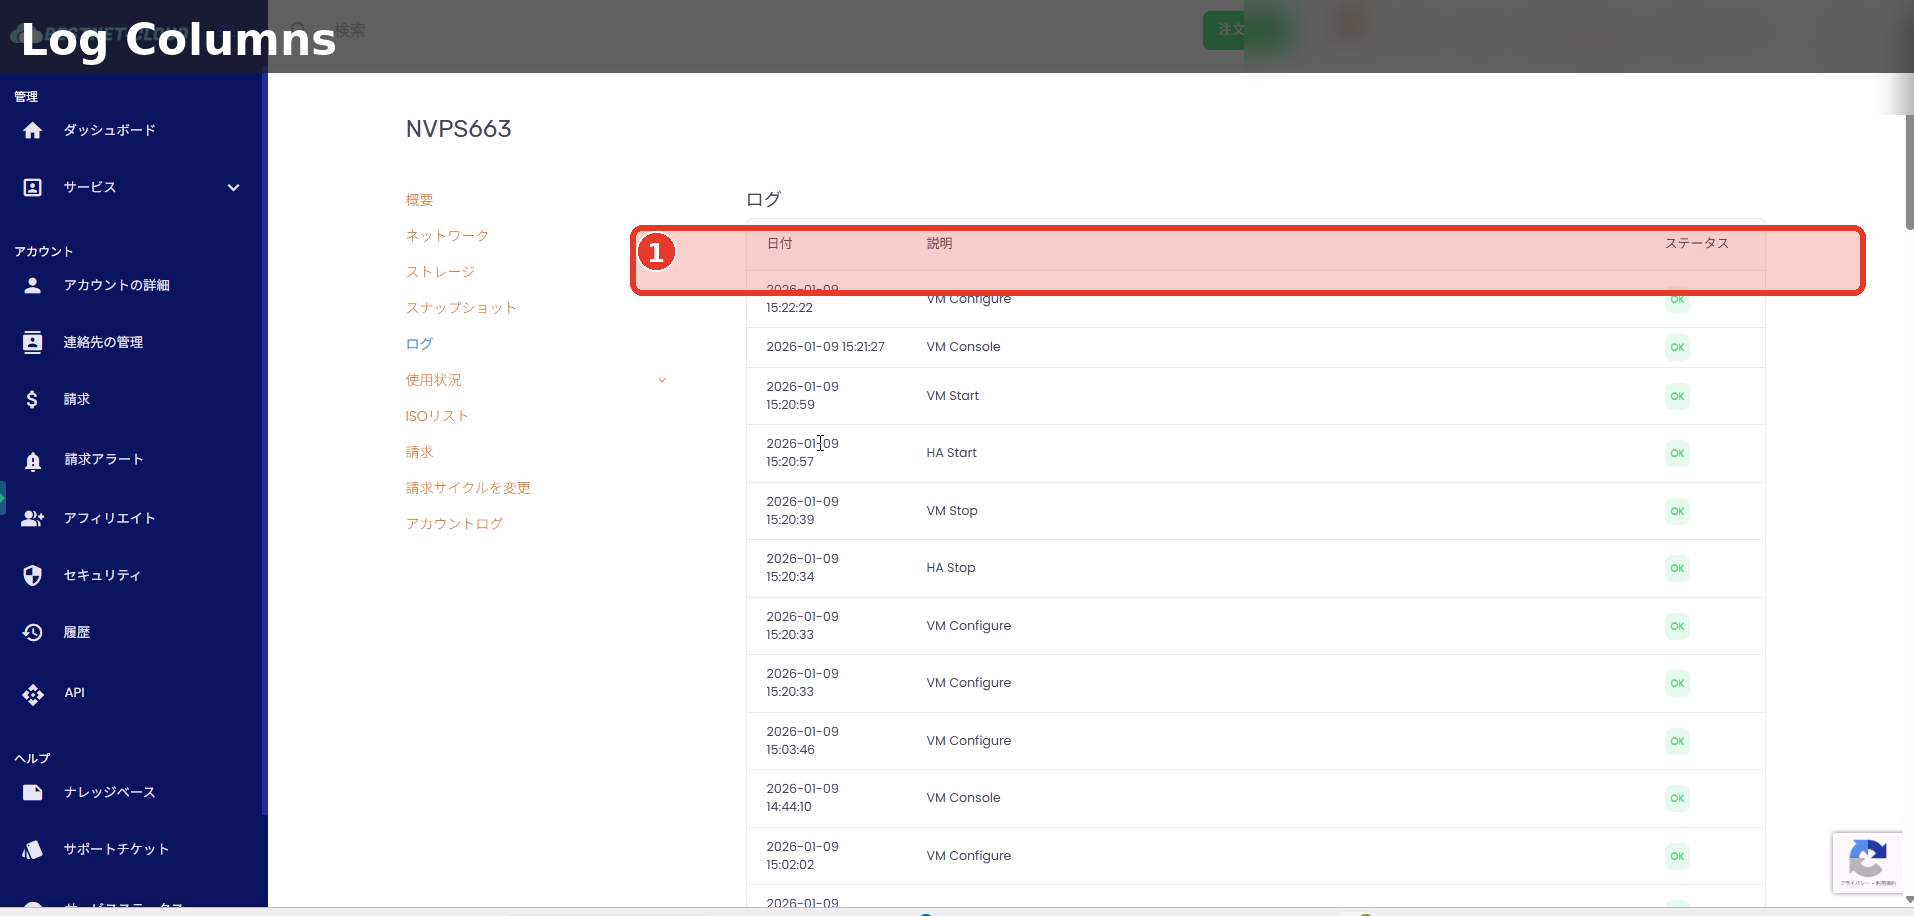
2. How to read logs #
- Date: Date and time when the event occurred
- Description: The operation performed (e.g., VM Start / VM Stop / VM Configure, etc.)
- Status: Processing result (e.g., OK)
3. Check older logs #
Scroll downward in the list to view older logs.
Checking Resource Graphs (Usage) #
1. Open “Usage” → “Resource” #
- Click “Usage” on the menu of the service details screen to expand it.
- Click “Resource” from the displayed submenu.

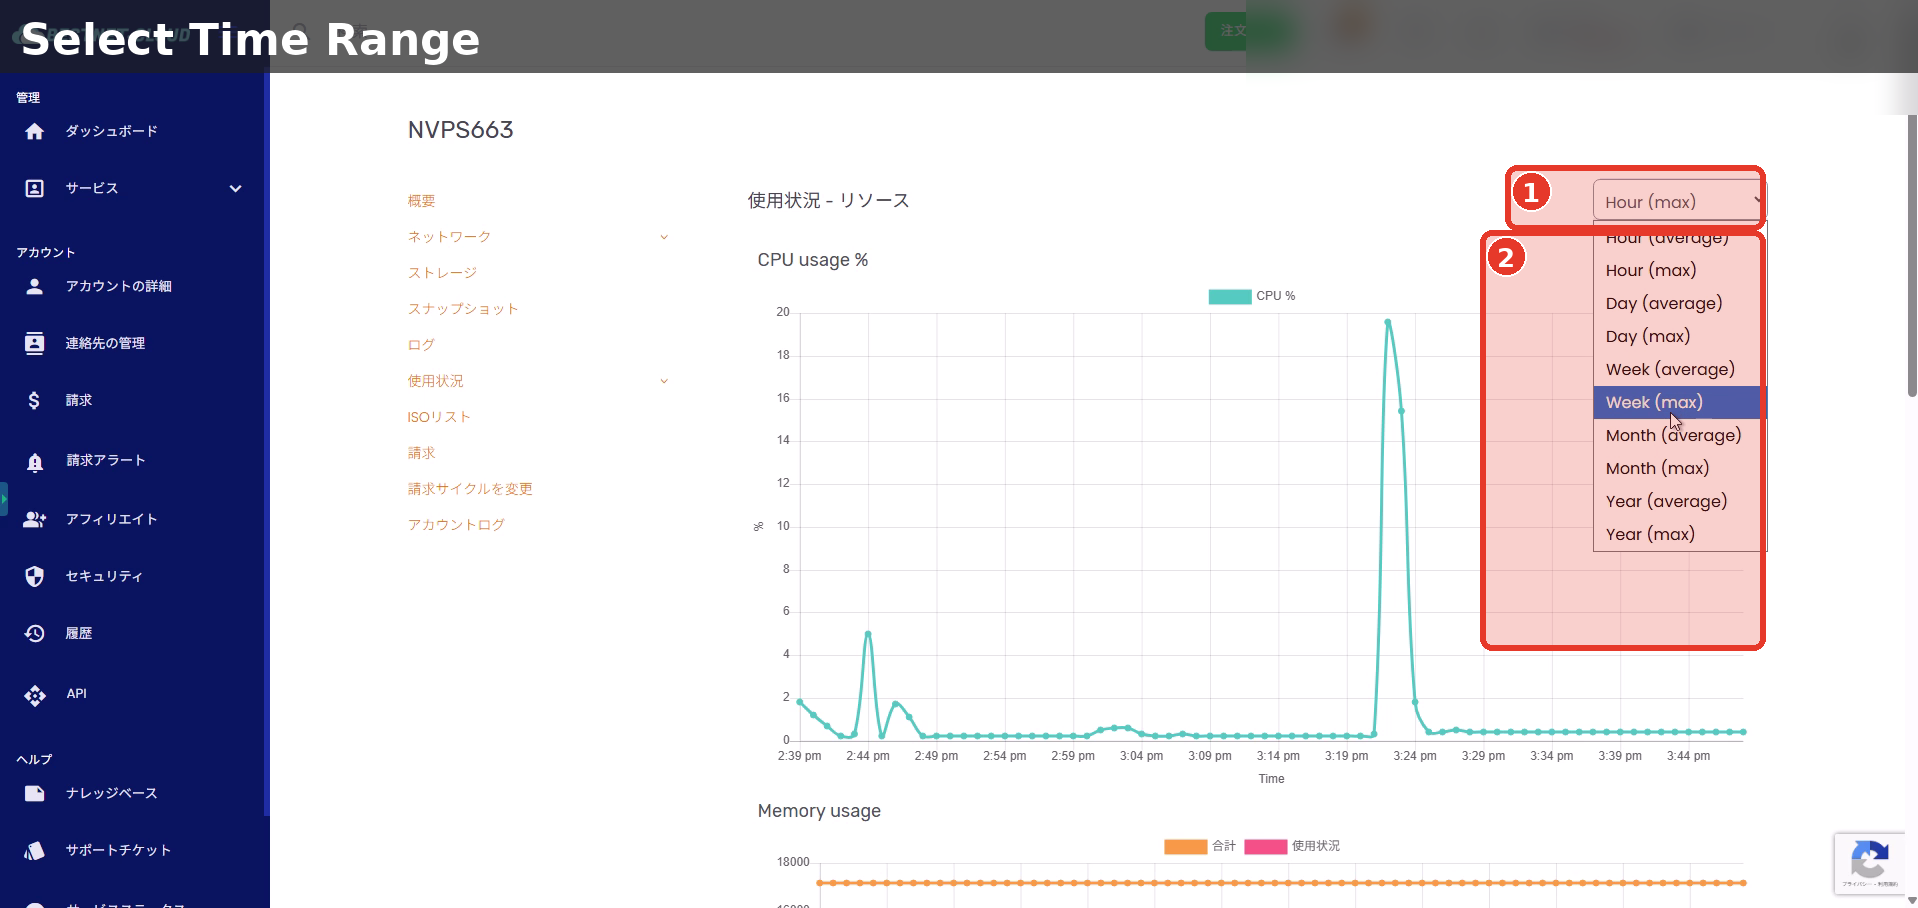
2. Change the display period (aggregation method) #
Use the dropdown on the upper right of the screen to switch between display periods and aggregation methods (average / max).
- Hour / Day / Week / Month / Year: Display period
- average: Average value
- max: Maximum value
3. Read graph values (tooltip) #
- Position your mouse cursor near the plot (point) at the time you want to check.
- A tooltip will display the date/time and value.
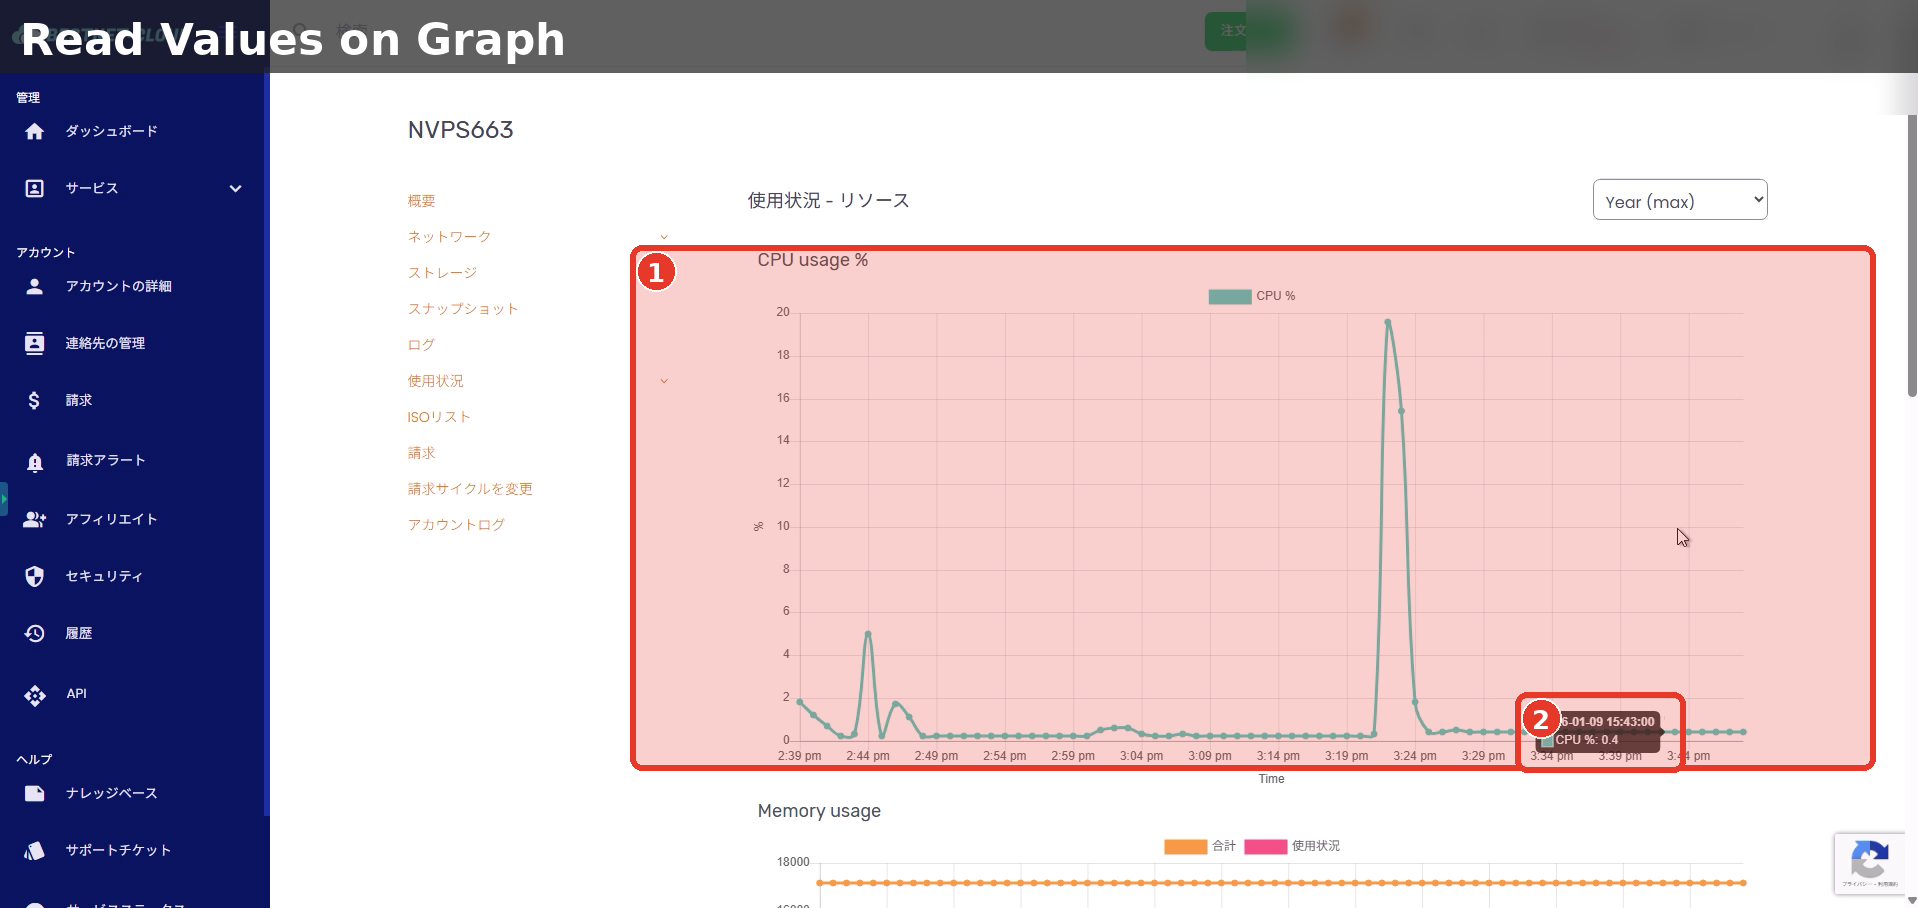
4. Representative metrics #
Scrolling the “Usage – Resource” screen will show graphs like the following.
CPU usage %
You can check the CPU usage rate.
Memory usage
You can check memory usage.
Disk IO
You can check disk Read / Write.